PC Crash Diagnostics & System Stability
Total PC Stability, Hardware Benchmarking & Second-Screen Mobile Telemetry
Diagnose mysterious game crashes, stress test hardware with surgical precision, chat with an integrated Gemini 3.5 AI troubleshooting agent, and turn your smartphone into a zero-latency, interactive desk HUD with fluid drag-and-drop widgets.
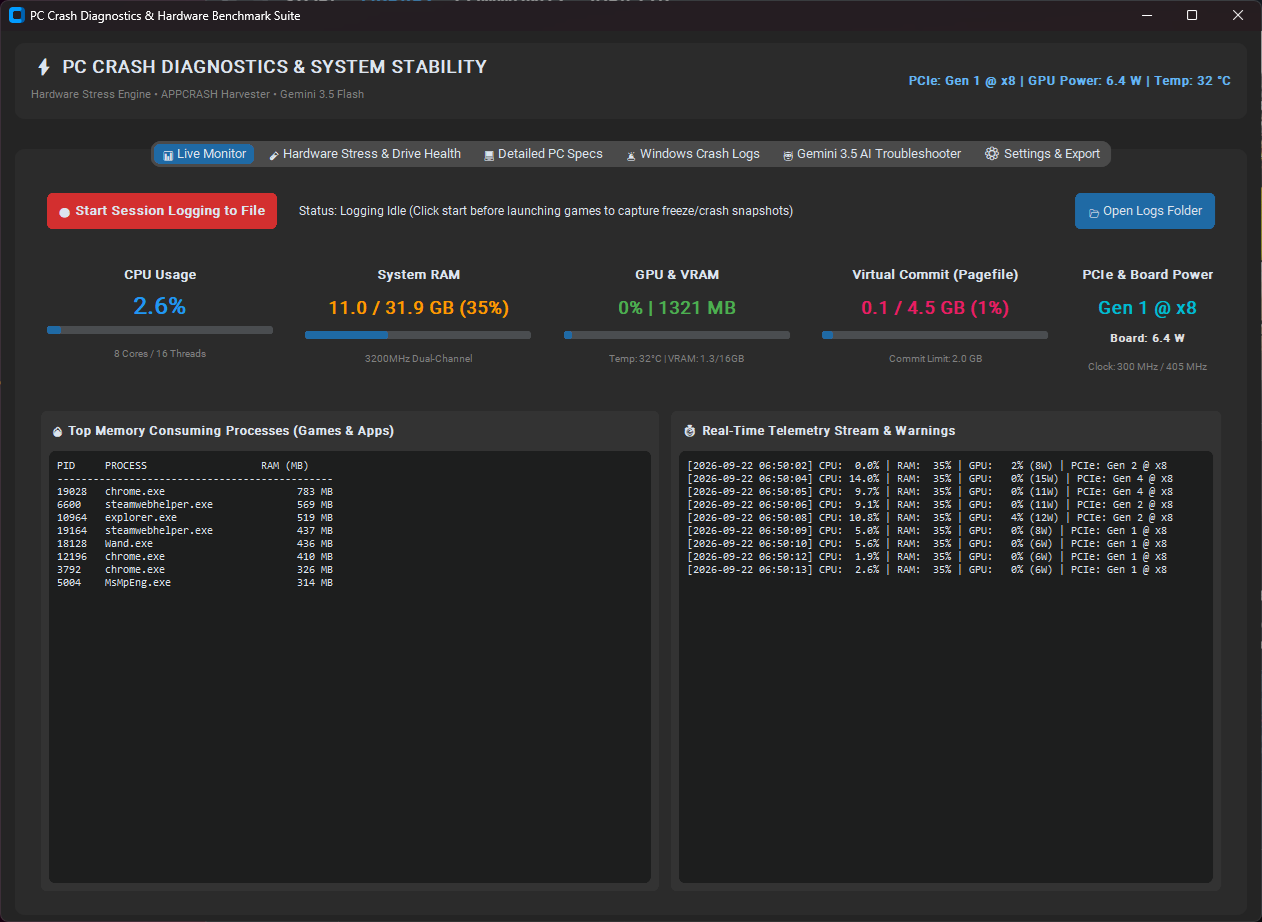
🖥️ PC Crash Diagnostics & Hardware Suite
A lightweight, portable Windows diagnostic and stress-testing workstation engineered for PC gamers, hardware enthusiasts, and system builders troubleshooting stubborn issues like access violations (0xc0000005), thermal throttling, RAM bit flips, and PCIe bandwidth bottlenecks.
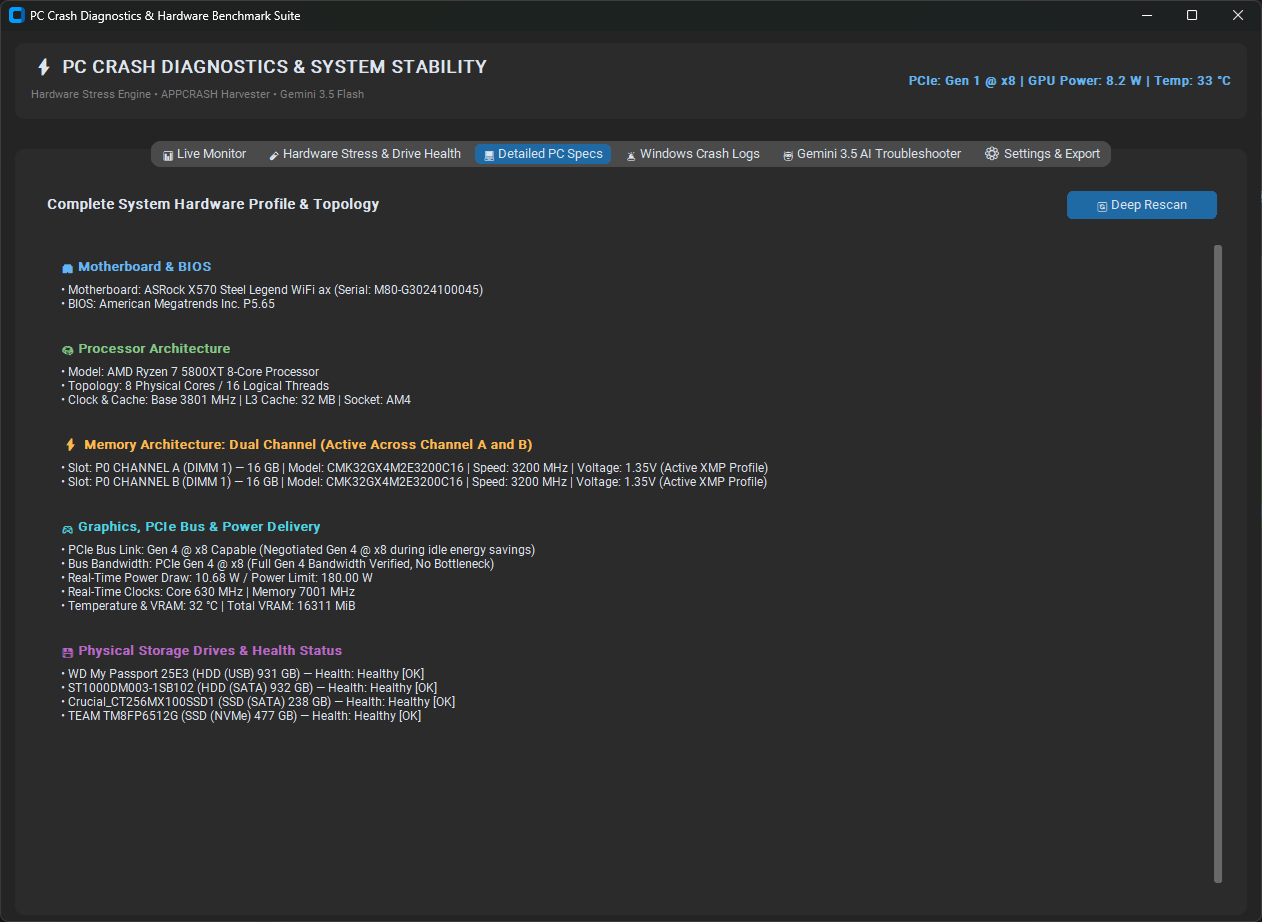
🔍 Deep Hardware & PCIe Harvester
- Precision Hardware Detection: Instant inventory of motherboard BIOS revisions, CPU core topologies, and dual-channel DDR4/DDR5 profiles.
- XMP & Voltage Audit: Detects active XMP/DOCP profiles to verify RAM is not running at unstable JEDEC defaults.
- Real-Time PCIe Link Monitoring: Actively distinguishes between idle power-saving and full-throttle Gen 4 @ x8/x16 under load.
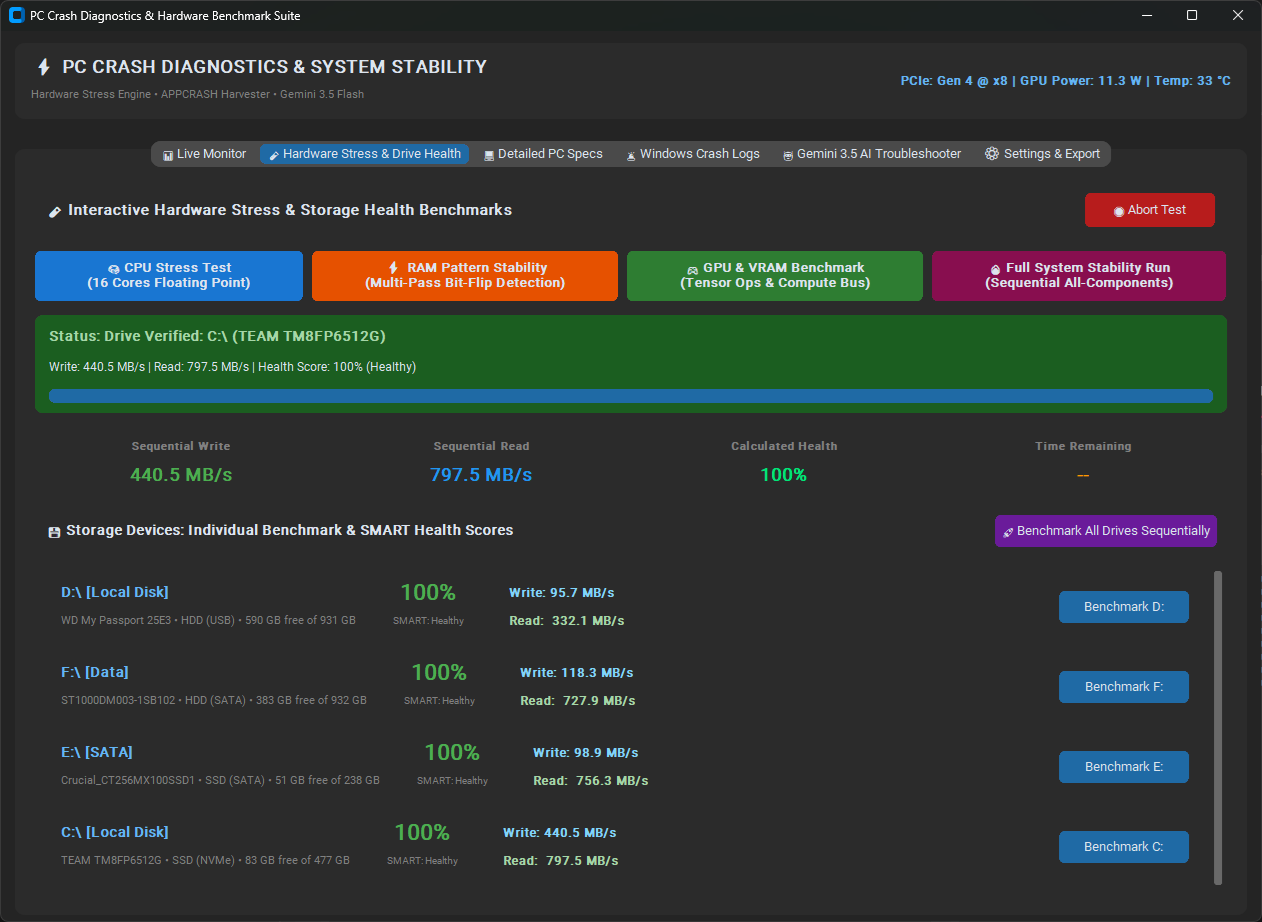
- SMART Storage Health: Queries NVMe SSDs, SATA drives, and external storage for health percentages and temperatures.
⚡ Multi-Subsystem Stress Benchmarks
- CPU Floating-Point Matrix Burn-In: Saturates all physical cores to expose cache and voltage instability.
- RAM Pattern Bit-Flip Tester: Allocates alternating bit patterns across memory to catch faulty DIMMs.
- GPU Tensor & Compute Benchmark: Stresses CUDA cores, VRAM bandwidth, and power limits.
- Non-Destructive Storage I/O Stress: Benchmark read/write throughput using safe sandboxed temp files.
🚨 Windows Crash Log Intelligence
- Direct Event Log Ingestion: Parses Windows Application Logs filtering for game crashes, Fault Module names, and crash codes.
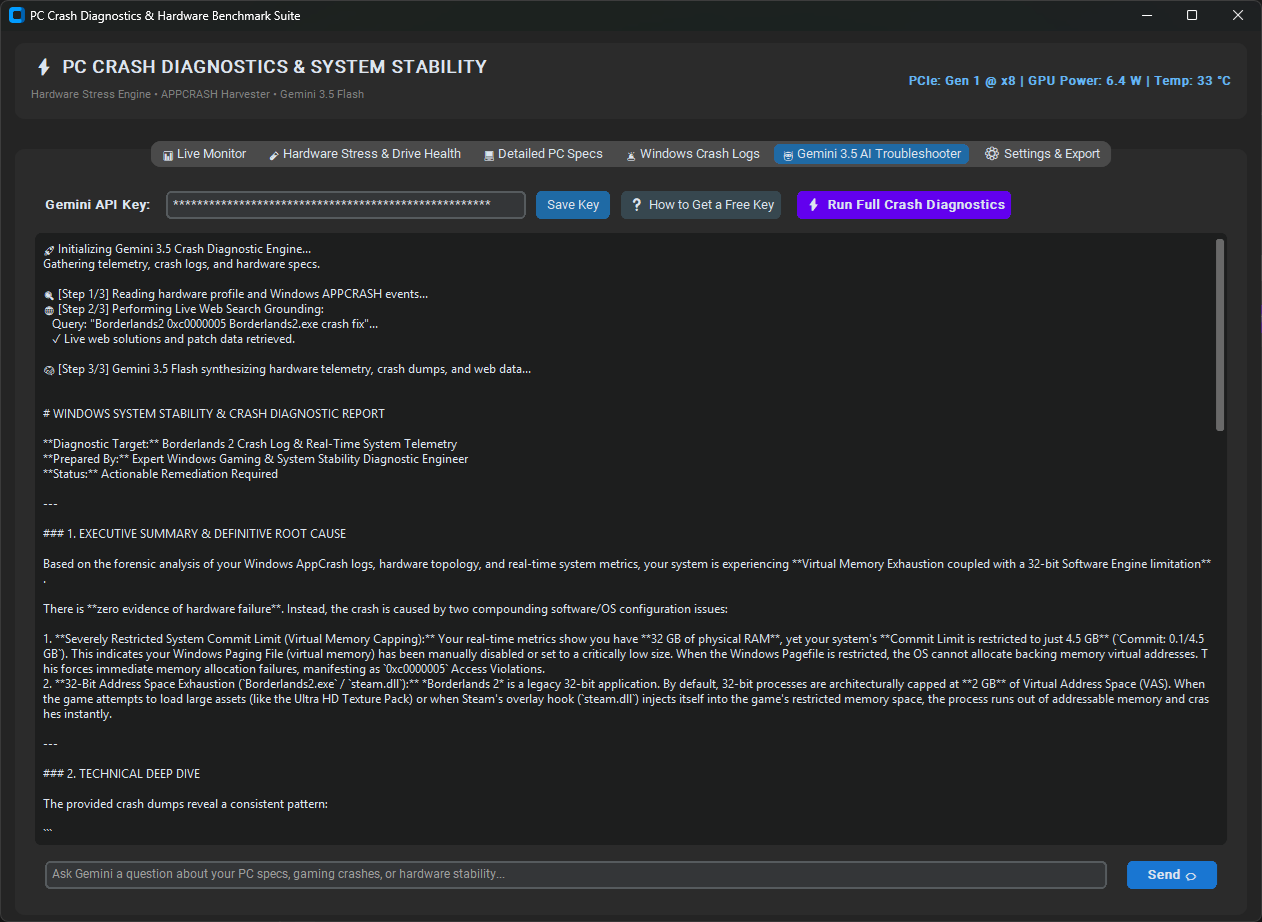
- Commit Limit & Pagefile Warnings: Identifies when an undersized Paging File is forcing out-of-memory crashes.
🧠 Gemini 3.5 AI Assistant
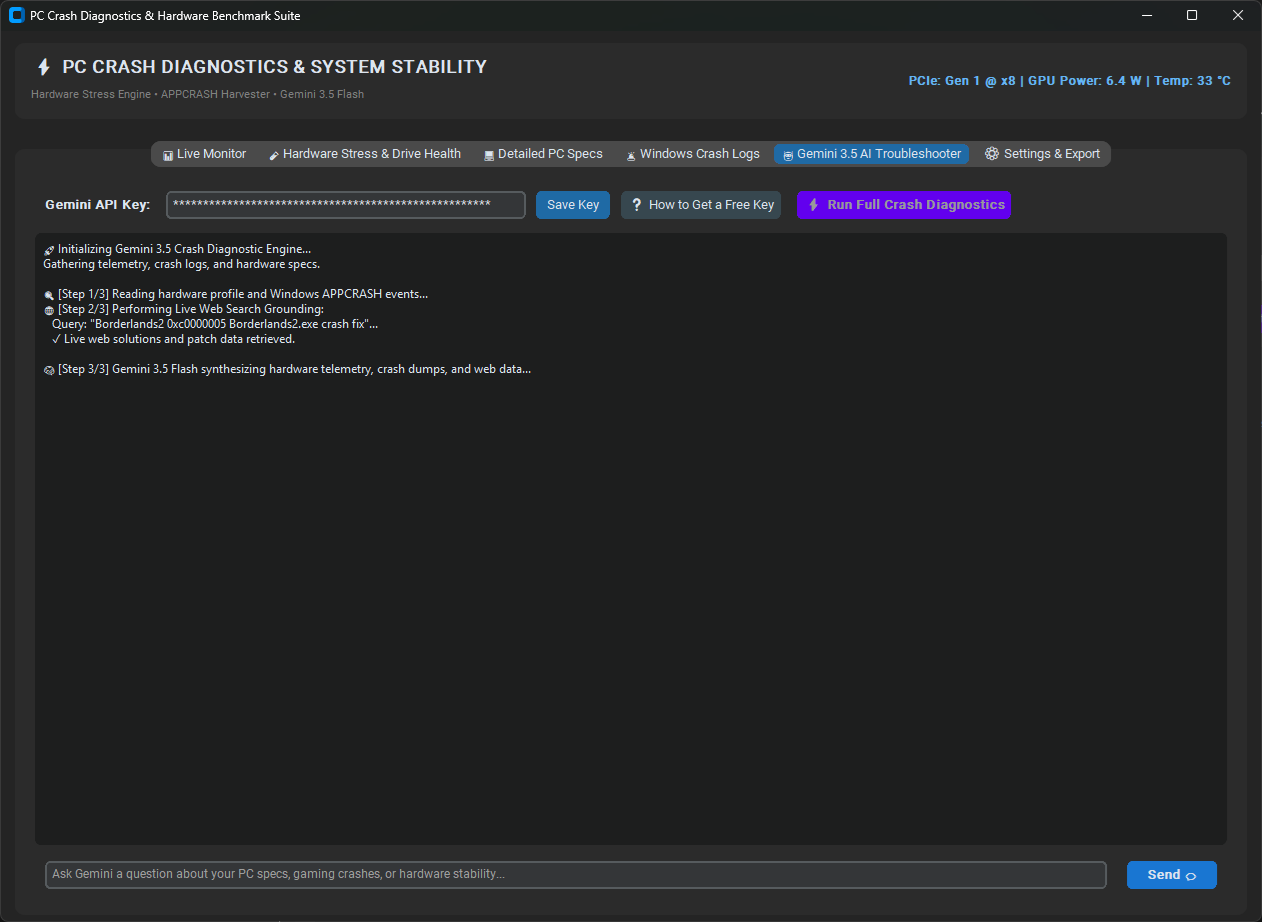
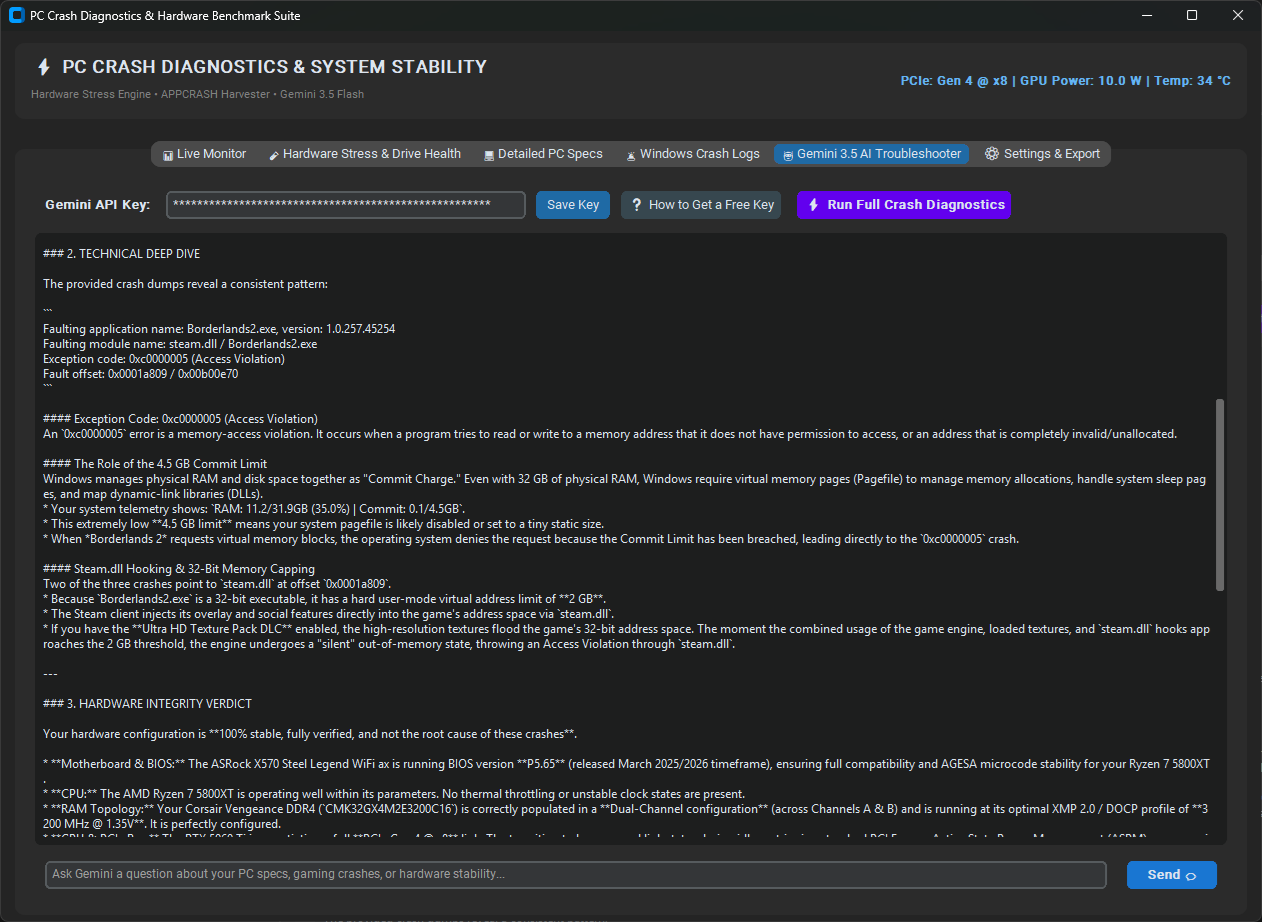
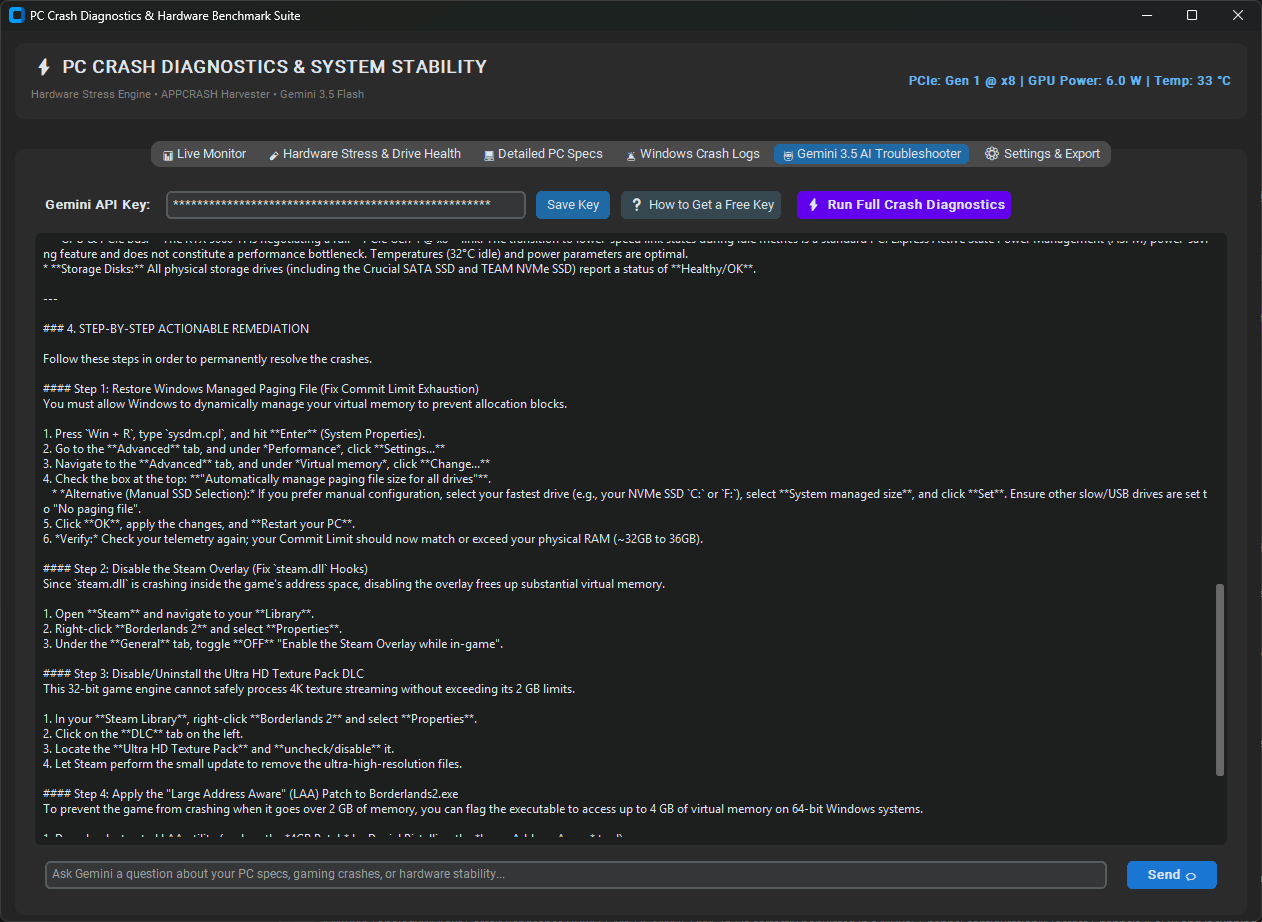
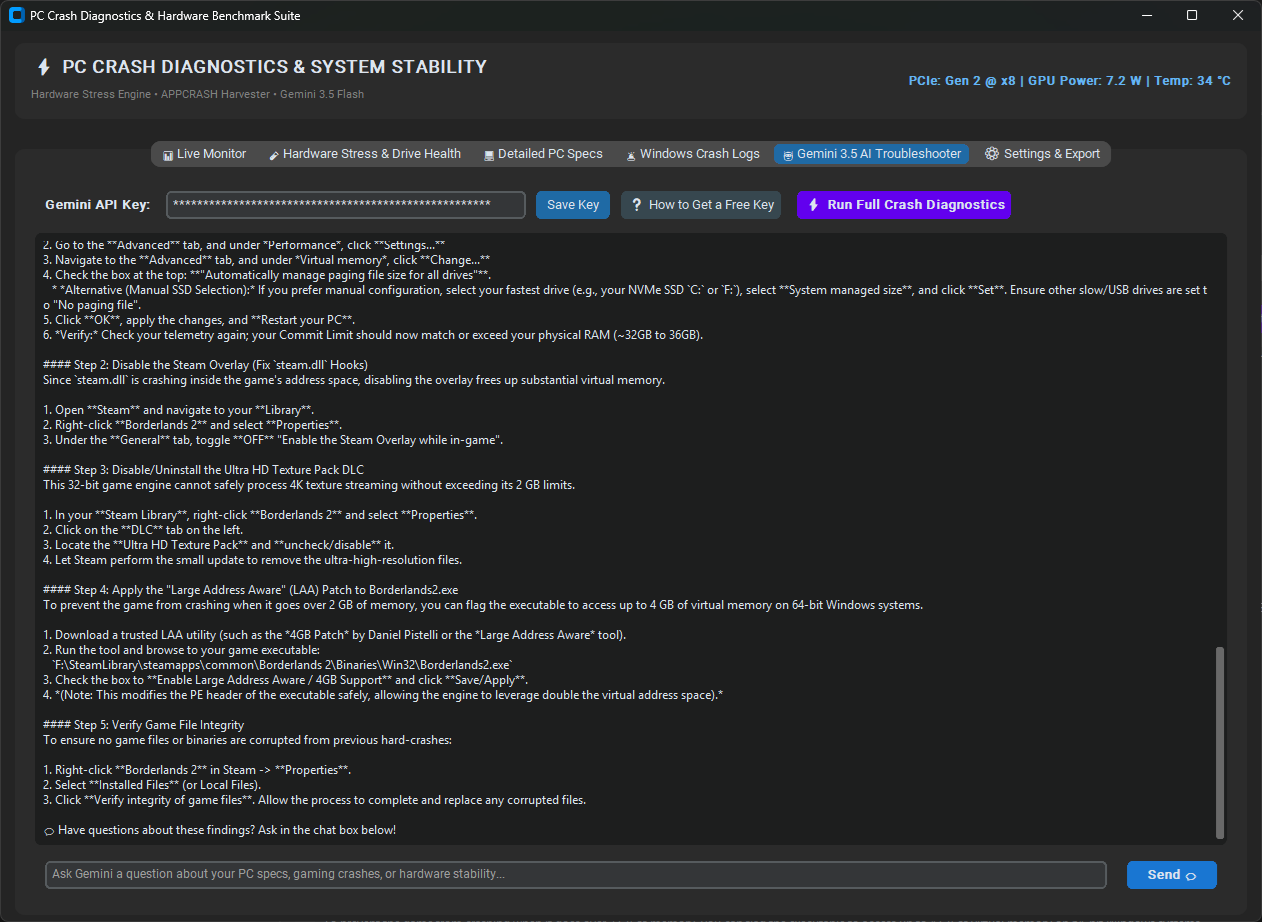
- Instant Diagnostic Analysis: One-click crash inspection feeds specs and traces directly to Gemini 3.5 Flash.
- Live Web Grounding: Uses Google Search to verify recent game patches and known driver bugs.
- Interactive Chat Console: Ask follow-up questions and receive actionable resolution advice.
📡 Zero-Config Local Telemetry Server
- Built-in HTTP server broadcasting on port
8089over LAN. - Accurate Hardware FPS: Direct Win32
EnumDisplaySettingsWhardware polling targeting high-refresh monitors. - Input Latency Metric (ms): Real-time responsiveness calculation using Windows
GetLastInputInfo.
📱 "PC Stability Monitor" Companion App
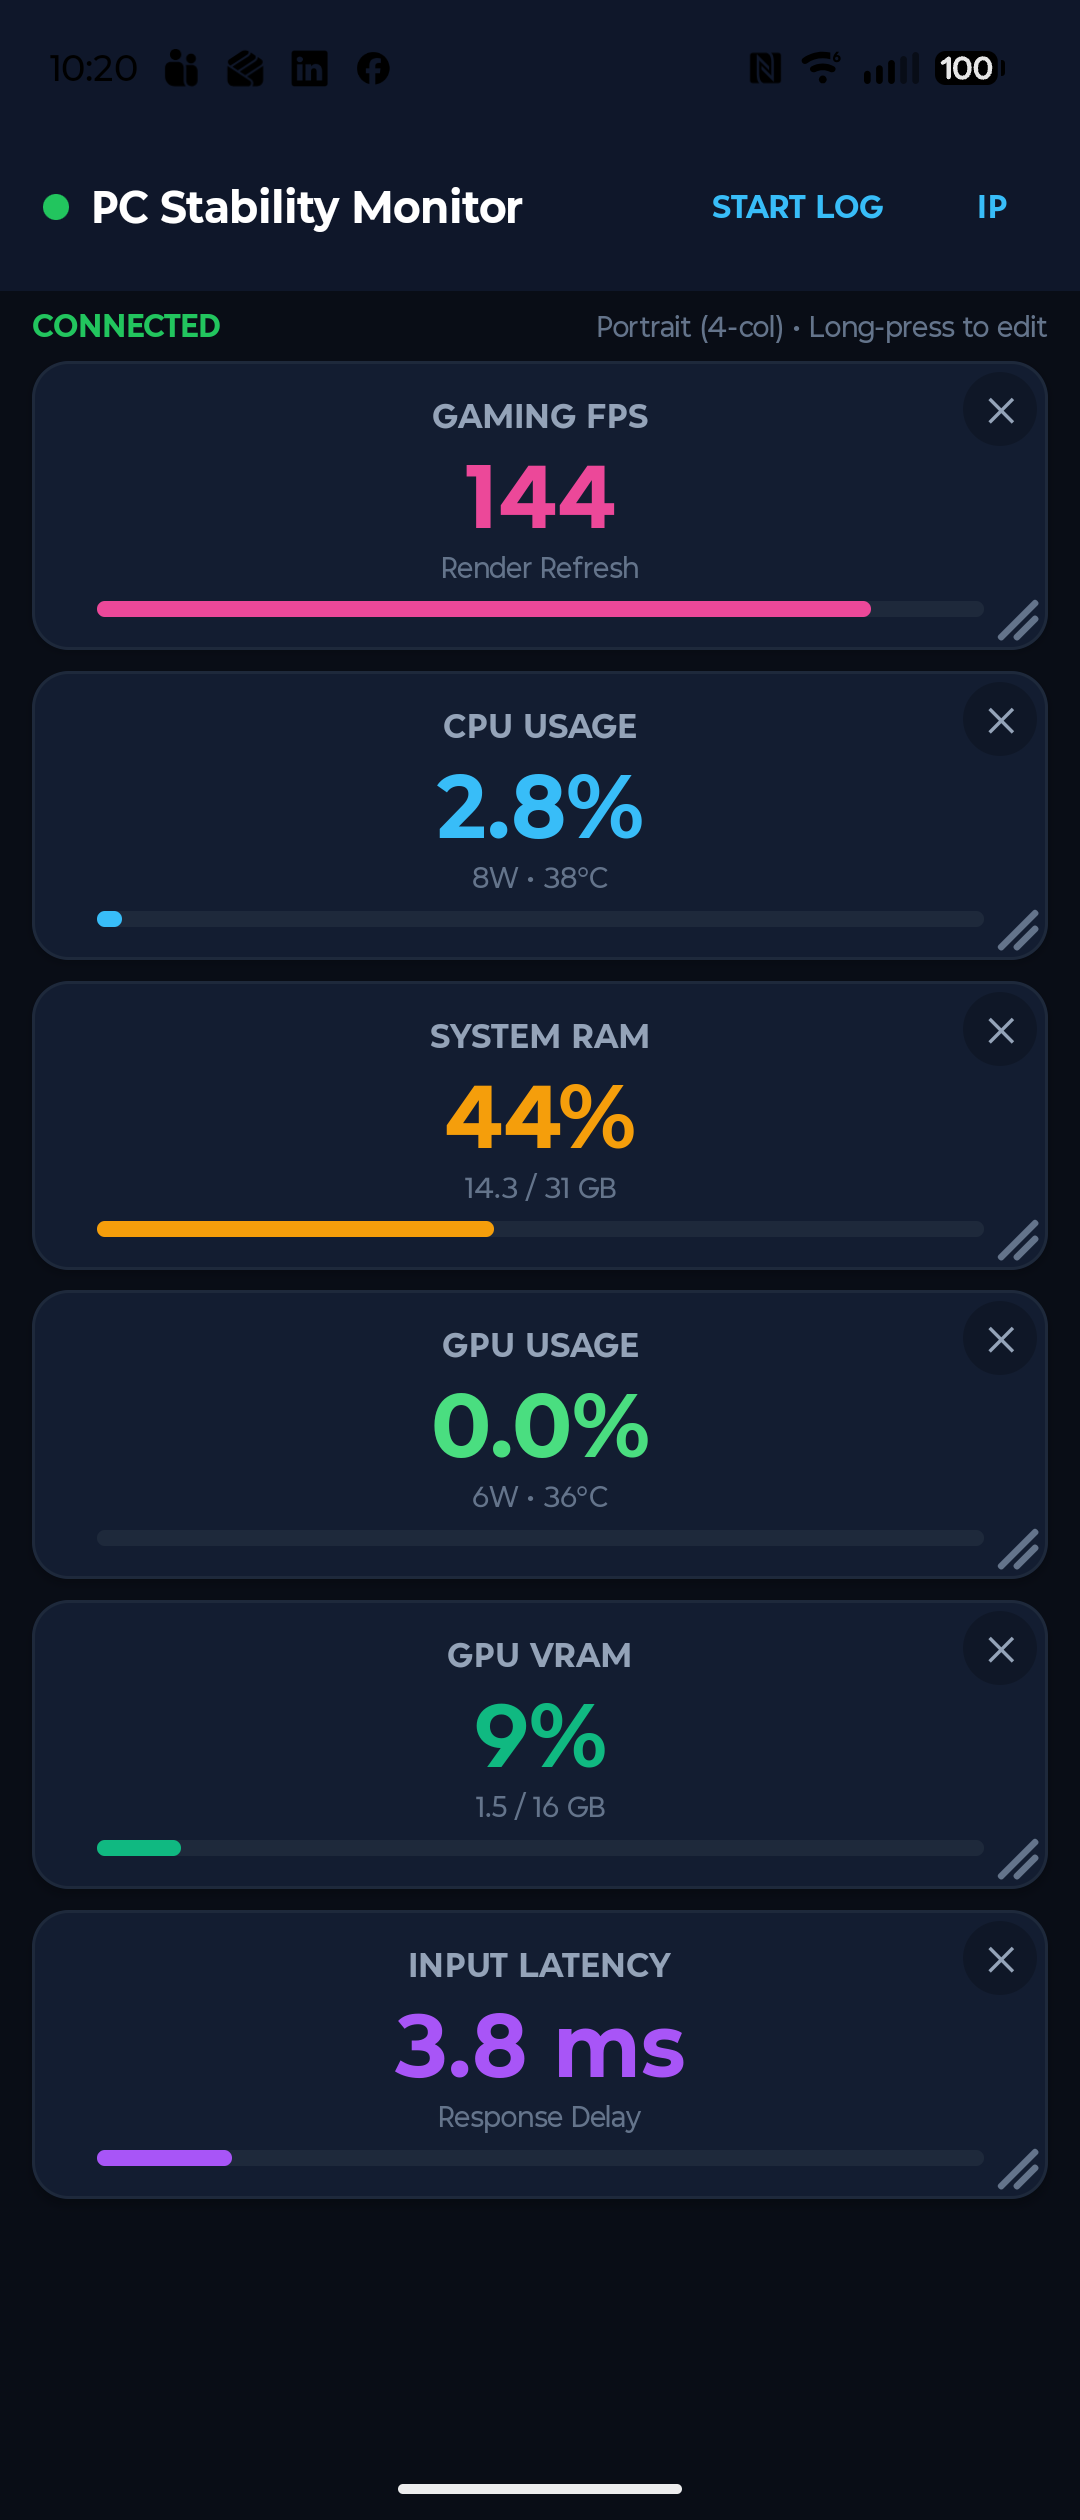
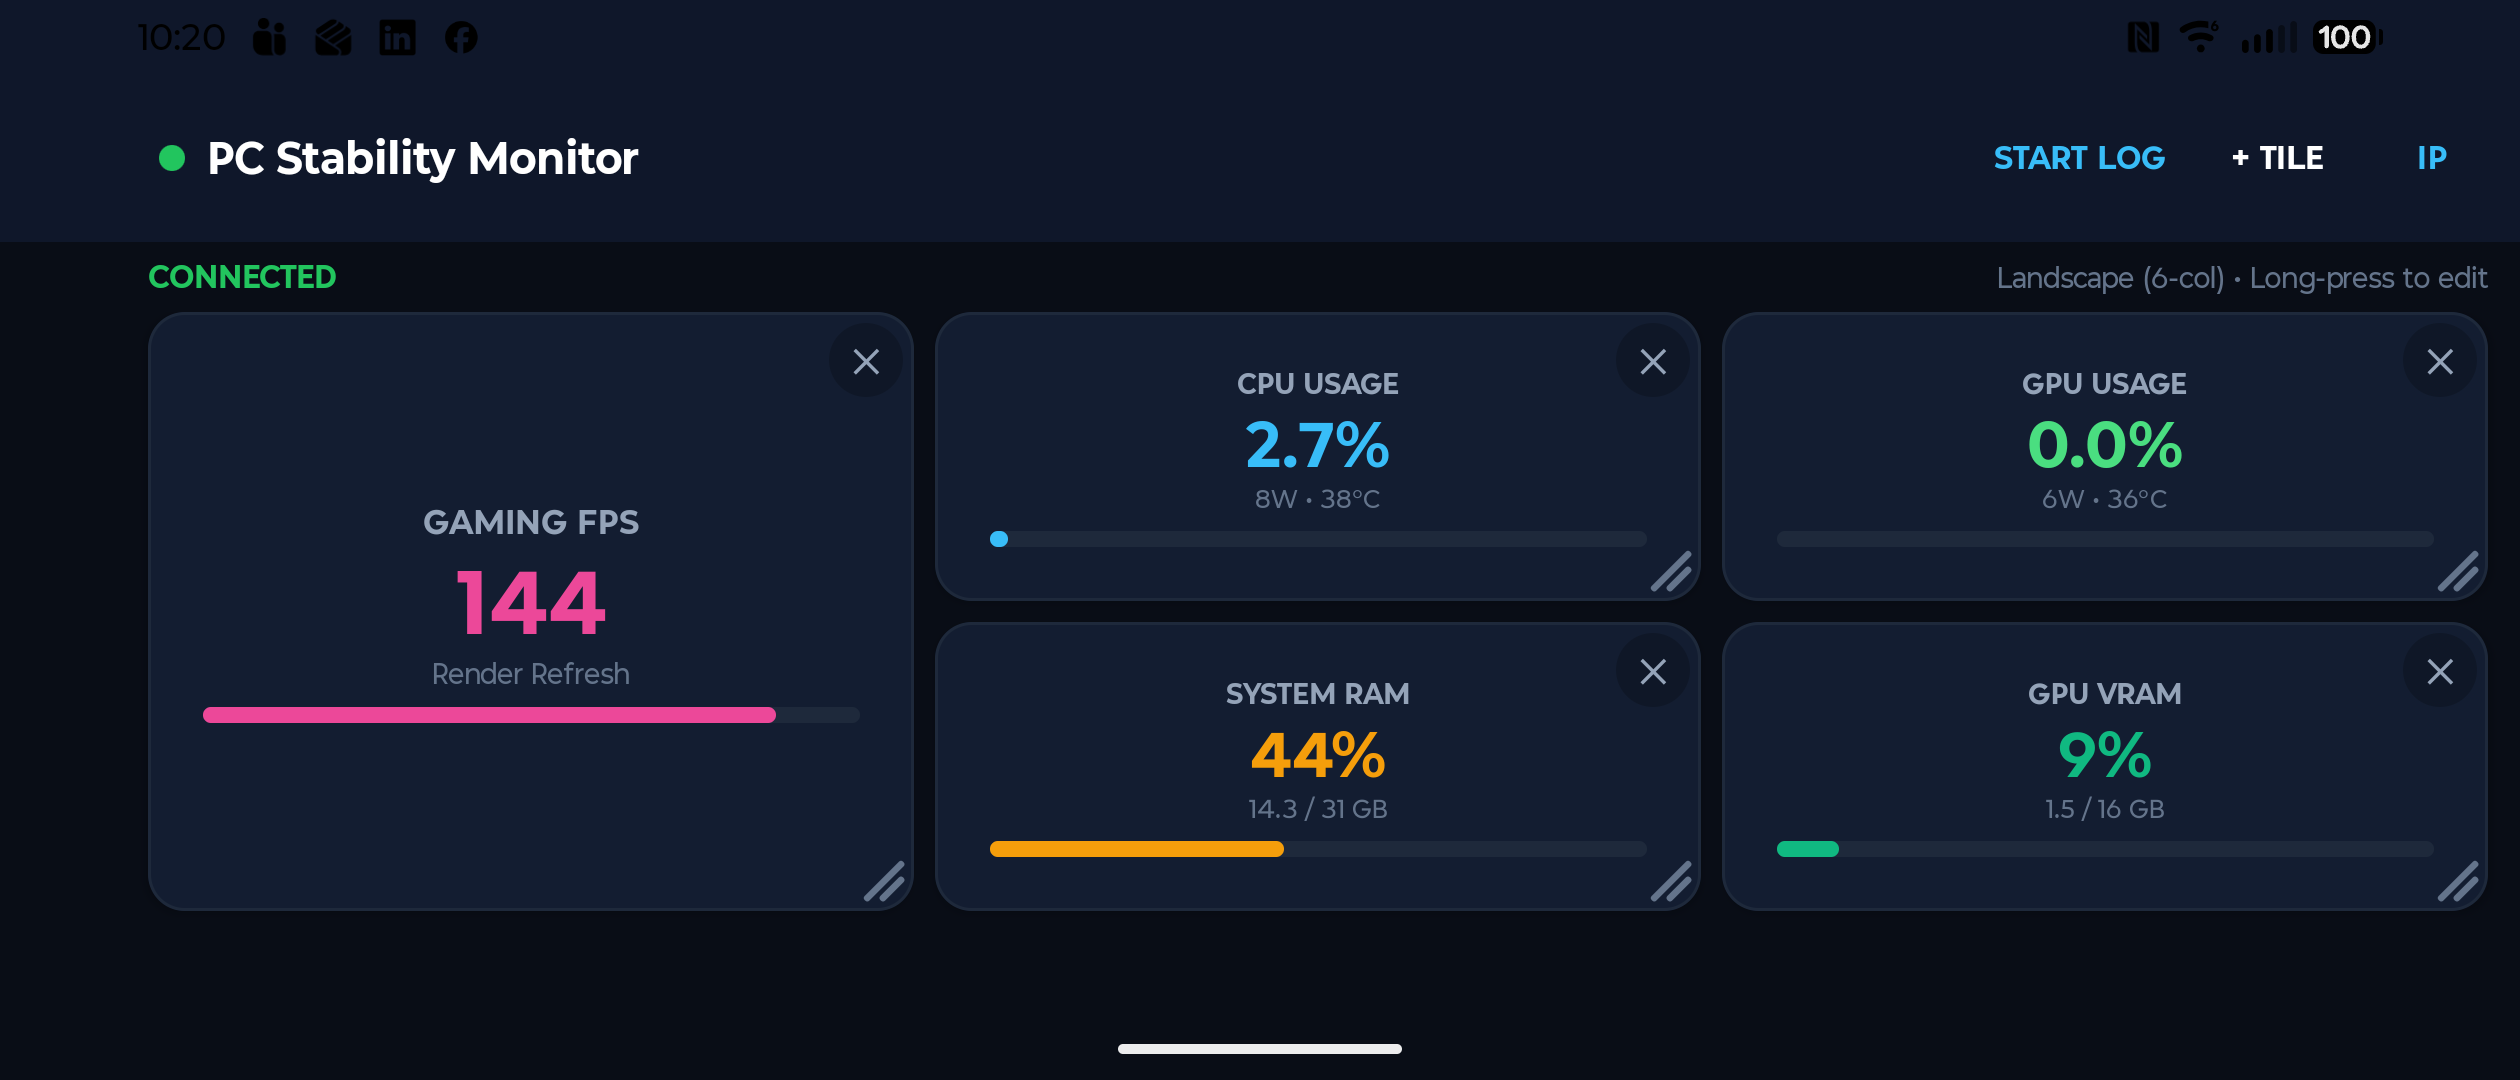
A second-screen gaming desk HUD that transforms any smartphone or tablet into a wireless PC performance monitor. Accessible via native Android app or universal mobile browser with zero setup—just scan the QR code on your PC screen.
📲 Instant QR Pairing
Scan to auto-open native Android app (or download APK), or instantly load the secure HTML5 Webview on iOS without installs.
🧩 Fluid HUD Widgets
Non-rigid organic drag-and-drop tiles. Resize dynamically with proportional typography scaling. Smart duplicate prevention.
🔄 Dual Layouts
Independent configurations for Portrait (4 columns) and Landscape (6 columns) built for various desk mount orientations.
💾 Layout Persistence
Never configure twice. App uses encrypted JSON SharedPreferences; Web Companion uses local browser storage.
📈 Session Charting
Record second-by-second hardware metrics directly to the device. Stop logging to instantly view vector sparkline polyline graphs.
☀️ Always-On Display
Leverages Android FLAG_KEEP_SCREEN_ON and HTML5 Screen Wake Lock API to ensure your HUD stays visible during long gaming stints.
📊 Metric Comparison Matrix
| Metric | Measurement | Why It Matters for Gaming |
|---|---|---|
| Gaming FPS | Real-time frame delivery (144Hz+) | Shows true in-game fluidity and dips below display refresh rates. |
| Input Latency | Milliseconds (ms) | Tracks hardware response delay between input and frame processing. |
| CPU Usage & Thermal | Usage %, Power (W), Temp (°C) | Identifies multi-core bottlenecks and cooling issues. |
| GPU Utilization | 3D Engine %, Power (W), Temp (°C) | Monitors graphics saturation, power draw, and thermal throttling. |
| System RAM | Used GB / Total GB + XMP | Verifies high-speed memory profiles and catches memory leaks. |
| GPU VRAM | Used GB / Total VRAM | Prevents texture stuttering from VRAM over-allocation. |
📦 Downloads & Installation
Application Gallery